> ## Documentation Index
> Fetch the complete documentation index at: https://upstash-dx-3081-agentkit-tanstack-ai-backends.mintlify.site/llms.txt
> Use this file to discover all available pages before exploring further.
# Prometheus - Upstash QStash Integration
To monitor your QStash metrics in Prometheus and visualize in Grafana, follow these steps:
**Integration Scope**
Upstash Prometheus Integration covers Prod Pack.
## **Step 1: Enable Prometheus in Upstash Console**
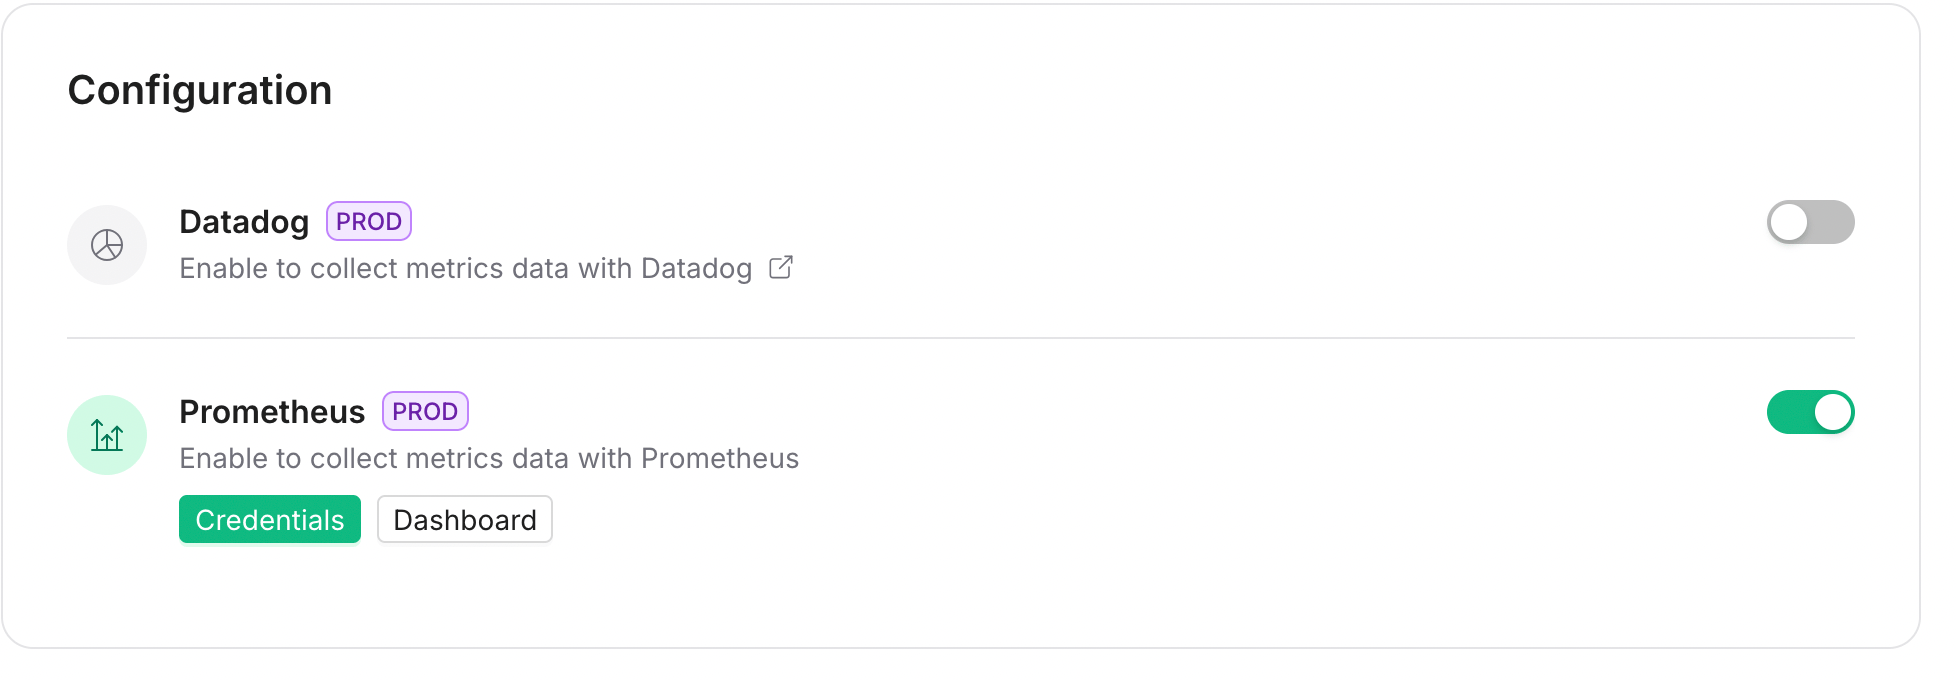
1. Open the Upstash Console and navigate to QStash.
2. Go to Settings → Monitoring.
3. Enable Prometheus to allow scraping QStash metrics.
 ## **Step 2: Copy Monitoring Token**
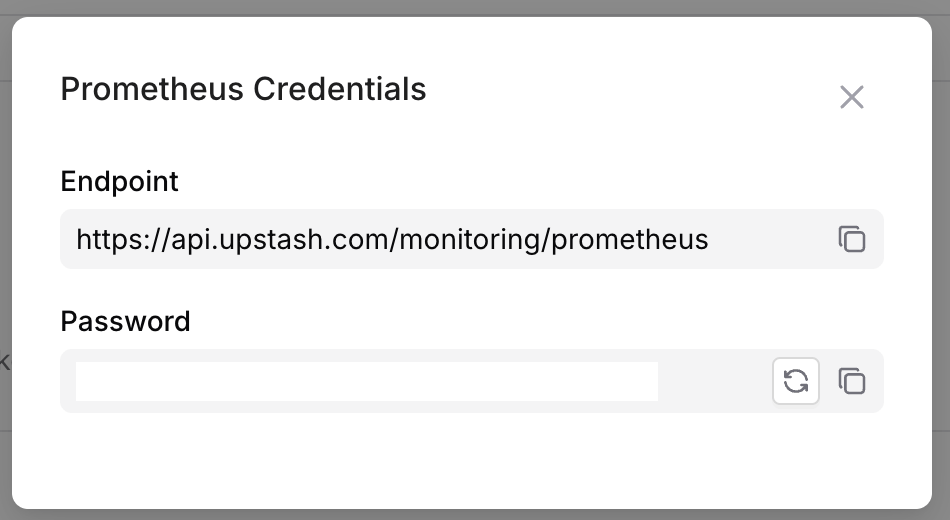
1. After enabling, a monitoring token is generated and displayed.
2. Copy the token. It will be used to authenticate Prometheus requests.
**Header Format**
Send the token as `Authorization: Bearer `.
## **Step 2: Copy Monitoring Token**
1. After enabling, a monitoring token is generated and displayed.
2. Copy the token. It will be used to authenticate Prometheus requests.
**Header Format**
Send the token as `Authorization: Bearer `.
 ## **Step 3: Set Up Prometheus Connection**
You can point Grafana directly at the Upstash endpoint, or federate QStash metrics into your own Prometheus server.
### **Grafana Data Source Setup**
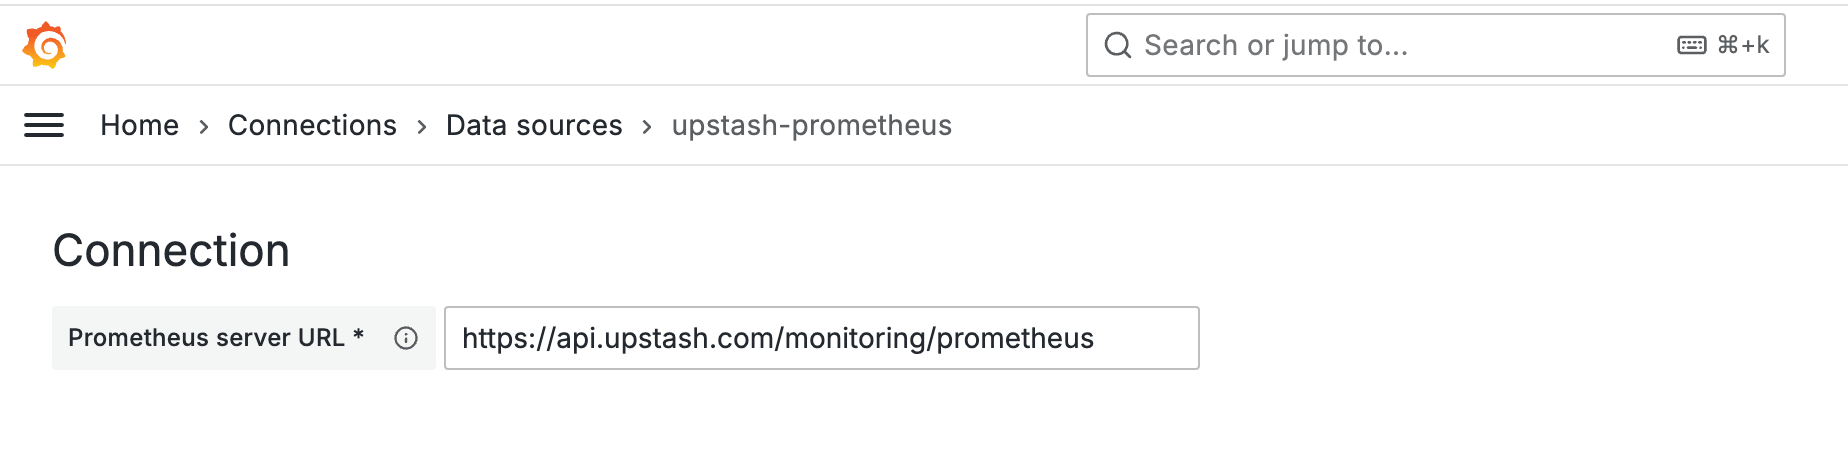
1. In Grafana, add a Prometheus data source.
2. Set the address to `https://api.upstash.com/monitoring/prometheus`.
3. In HTTP headers, add the monitoring token.
## **Step 3: Set Up Prometheus Connection**
You can point Grafana directly at the Upstash endpoint, or federate QStash metrics into your own Prometheus server.
### **Grafana Data Source Setup**
1. In Grafana, add a Prometheus data source.
2. Set the address to `https://api.upstash.com/monitoring/prometheus`.
3. In HTTP headers, add the monitoring token.
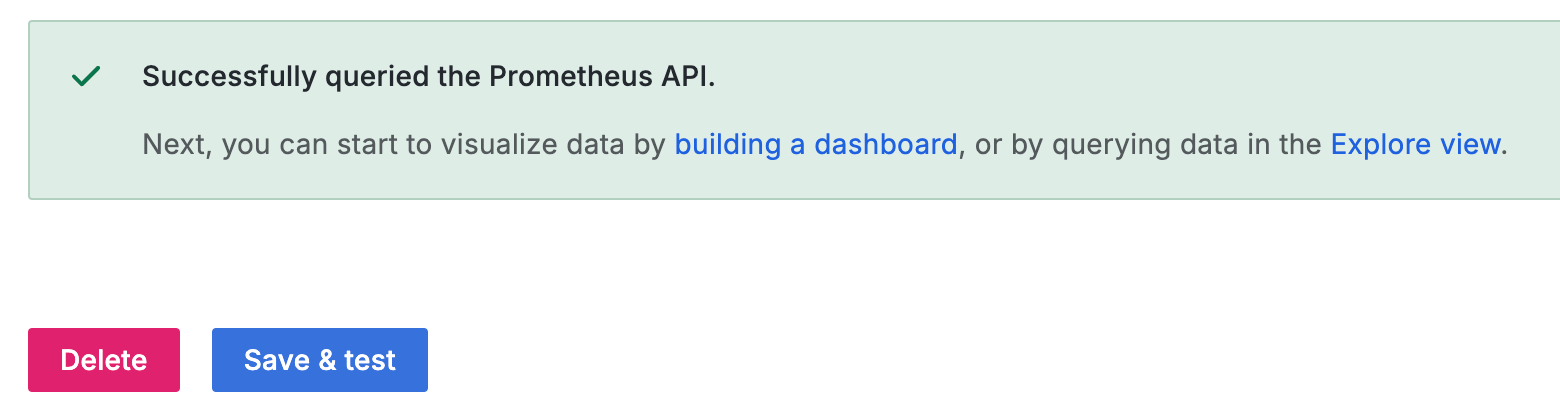
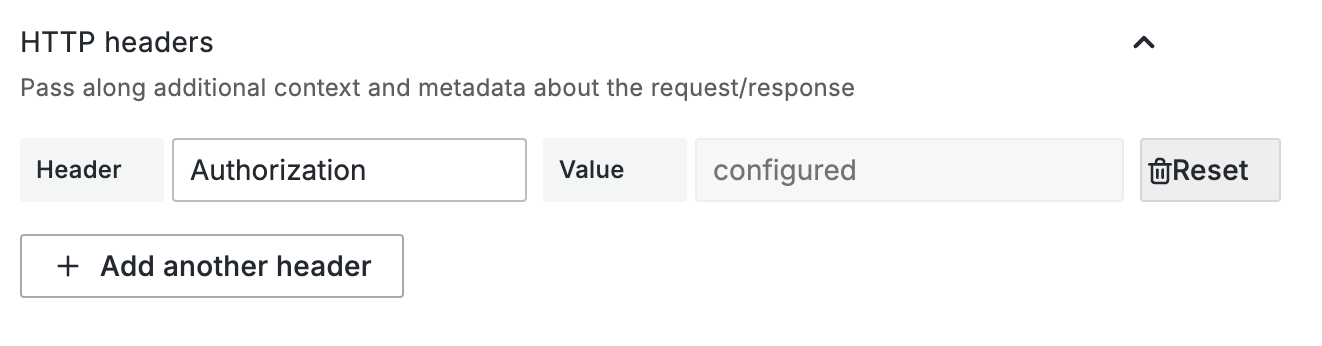 Click Test and Save.
 ### **Prometheus Federation Setup**
Federation lets your Prometheus pull QStash metrics from the Upstash API and store them in **your own** Prometheus instance, so Grafana can query your Prometheus instead of hitting the Upstash endpoint directly.
#### When to use federation
* You already run Prometheus and want to persist QStash metrics locally.
* You want to control retention, recording rules, or alerts on QStash metrics.
1. Add a scrape job to your Prometheus configuration file (`prometheus.yml`):
```yaml theme={null}
scrape_configs:
# Federation job: pull QStash metrics from Upstash API
- job_name: "federate_upstash_qstash"
honor_labels: true
metrics_path: "/monitoring/prometheus/federate"
scheme: https
params:
match[]:
- 'qstash_public_metrics{}'
static_configs:
- targets:
- "api.upstash.com"
authorization:
type: Bearer
credentials: ""
```
QStash metrics are exposed as `qstash_public_metrics`. The `upstash_db_metrics` selector in the [Redis Prometheus guide](/redis/integrations/prometheus) only matches Redis metrics, so a QStash scrape job that uses it returns no QStash metrics.
This configuration pulls all QStash metrics. You can adjust the `match[]` parameter to filter them:
* `qstash_public_metrics{region="us-east-1"}` pulls metrics for QStash in a specific region
* `qstash_public_metrics{metric_name="dlq_message_count"}` pulls a specific metric
2. Verify the federation target
* Reload (or restart) your Prometheus server to apply the new configuration.
* Visit **Prometheus → Status → Targets** and confirm `federate_upstash_qstash` is **UP**.
## **Step 4: Import Dashboard**
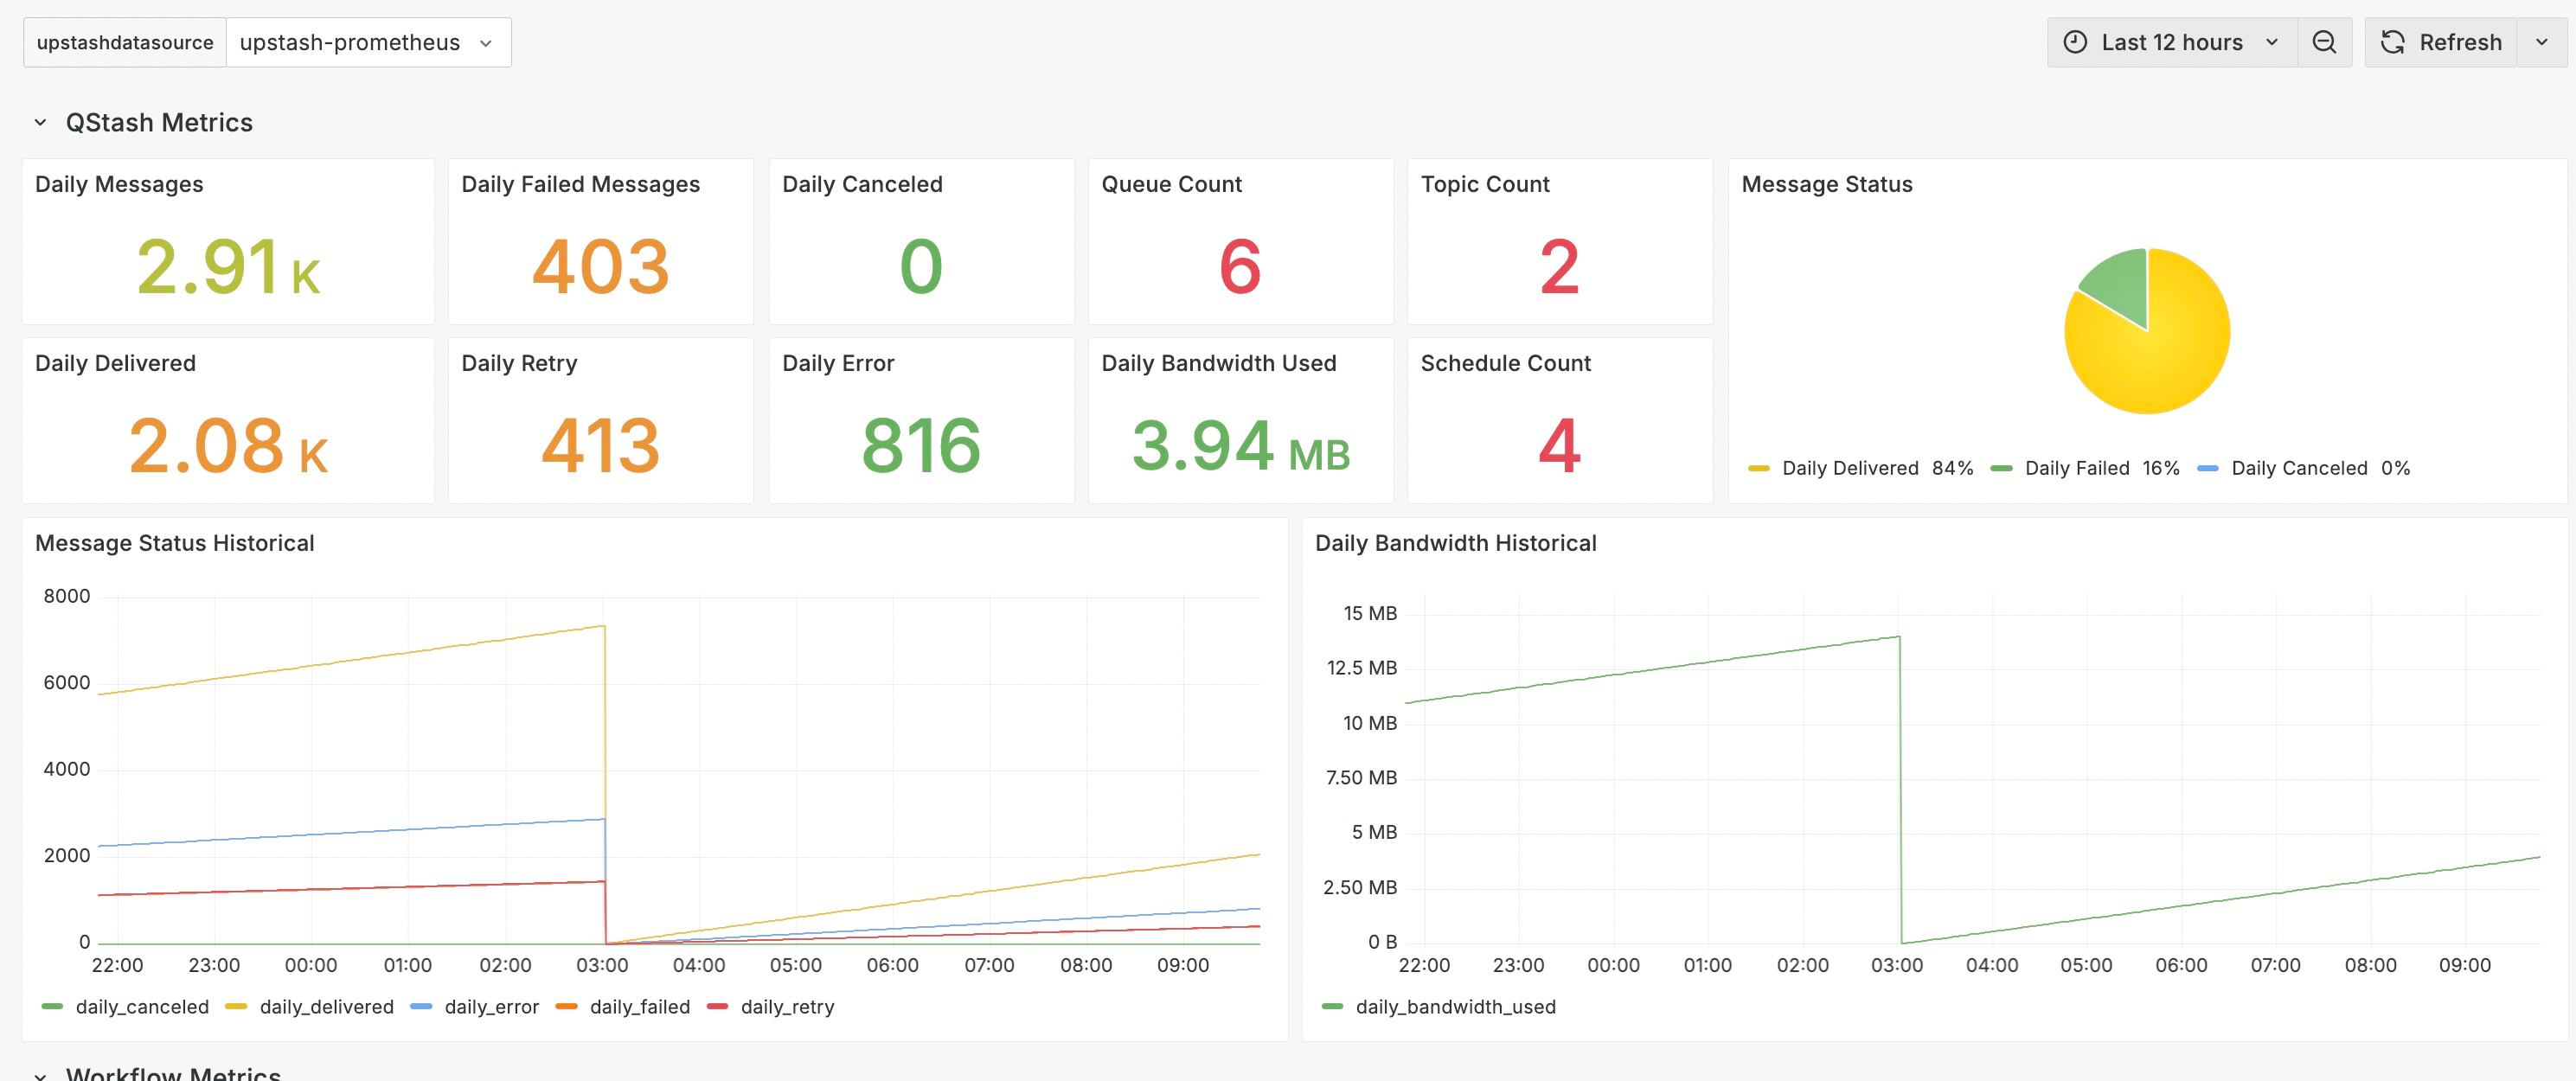
You can use the Upstash Grafana dashboard to visualize QStash metrics.
Open the import dialog and use: Upstash QStash Dashboard
### **Prometheus Federation Setup**
Federation lets your Prometheus pull QStash metrics from the Upstash API and store them in **your own** Prometheus instance, so Grafana can query your Prometheus instead of hitting the Upstash endpoint directly.
#### When to use federation
* You already run Prometheus and want to persist QStash metrics locally.
* You want to control retention, recording rules, or alerts on QStash metrics.
1. Add a scrape job to your Prometheus configuration file (`prometheus.yml`):
```yaml theme={null}
scrape_configs:
# Federation job: pull QStash metrics from Upstash API
- job_name: "federate_upstash_qstash"
honor_labels: true
metrics_path: "/monitoring/prometheus/federate"
scheme: https
params:
match[]:
- 'qstash_public_metrics{}'
static_configs:
- targets:
- "api.upstash.com"
authorization:
type: Bearer
credentials: ""
```
QStash metrics are exposed as `qstash_public_metrics`. The `upstash_db_metrics` selector in the [Redis Prometheus guide](/redis/integrations/prometheus) only matches Redis metrics, so a QStash scrape job that uses it returns no QStash metrics.
This configuration pulls all QStash metrics. You can adjust the `match[]` parameter to filter them:
* `qstash_public_metrics{region="us-east-1"}` pulls metrics for QStash in a specific region
* `qstash_public_metrics{metric_name="dlq_message_count"}` pulls a specific metric
2. Verify the federation target
* Reload (or restart) your Prometheus server to apply the new configuration.
* Visit **Prometheus → Status → Targets** and confirm `federate_upstash_qstash` is **UP**.
## **Step 4: Import Dashboard**
You can use the Upstash Grafana dashboard to visualize QStash metrics.
Open the import dialog and use: Upstash QStash Dashboard
 ## **Conclusion**
You’ve integrated QStash with Prometheus. Use Grafana to explore message throughput, retries, DLQ, schedules, and Upstash Workflows.
If you encounter issues, contact support.
## Related topics
- [Prometheus - Upstash QStash Integration](/workflow/integrations/prometheus.md)
- [Prometheus - Upstash Redis Integration](/redis/integrations/prometheus.md)
- [Datadog - Upstash QStash Integration](/qstash/integrations/datadog.md)
- [Prod Pack & Enterprise](/qstash/overall/enterprise.md)
## **Conclusion**
You’ve integrated QStash with Prometheus. Use Grafana to explore message throughput, retries, DLQ, schedules, and Upstash Workflows.
If you encounter issues, contact support.
## Related topics
- [Prometheus - Upstash QStash Integration](/workflow/integrations/prometheus.md)
- [Prometheus - Upstash Redis Integration](/redis/integrations/prometheus.md)
- [Datadog - Upstash QStash Integration](/qstash/integrations/datadog.md)
- [Prod Pack & Enterprise](/qstash/overall/enterprise.md)